

The SlabCalc Concrete Cost Index: What Flatwork Actually Costs in 26 US Metros (2026)
Built from the winning unit bids on 1233 public sidewalk contracts let in 2023–2026, read line by line from the bid tabulations of 16 public agencies, each metro from its own agency district. This is not another aggregation of contractor-submitted estimates — it is primary government procurement data, and every bid line behind it is published.
Data last updated: October 12, 2026
Key Findings
Most vs. least expensive metro
New York, NY costs 4.11× as much as Atlanta, GA
$13.68/sq ft vs. $3.33/sq ft, low end of the professional installed sidewalk range, metros priced from their own bid data only.
National price band
$3.33–$33.33 per sq ft
Professional installed range across the 26 bid-data metros for a standard concrete sidewalk placement.
National median cost
$9.89 per sq ft
Median professional installed sidewalk cost across the 26 bid-data metros — the single figure to cite for “what concrete costs” nationally.
Sun Belt vs. cold-climate/coastal premium
$9.40 vs. $11.97 per sq ft
Northern and coastal metros (10) average 27.34% higher than Sun Belt metros (8), driven by frost-depth footings, prevailing-wage labor, and shorter construction seasons.
Sun Belt = hot-dry, hot-humid, and hot-mixed climate metros; Northern/coastal = cold-humid and marine climate metros, as classified in SlabCalc's metro dataset. Mediterranean (CA), semi-arid (Denver), and mixed-humid Southeast metros are excluded from this specific comparison because they don't cleanly fit either bucket.
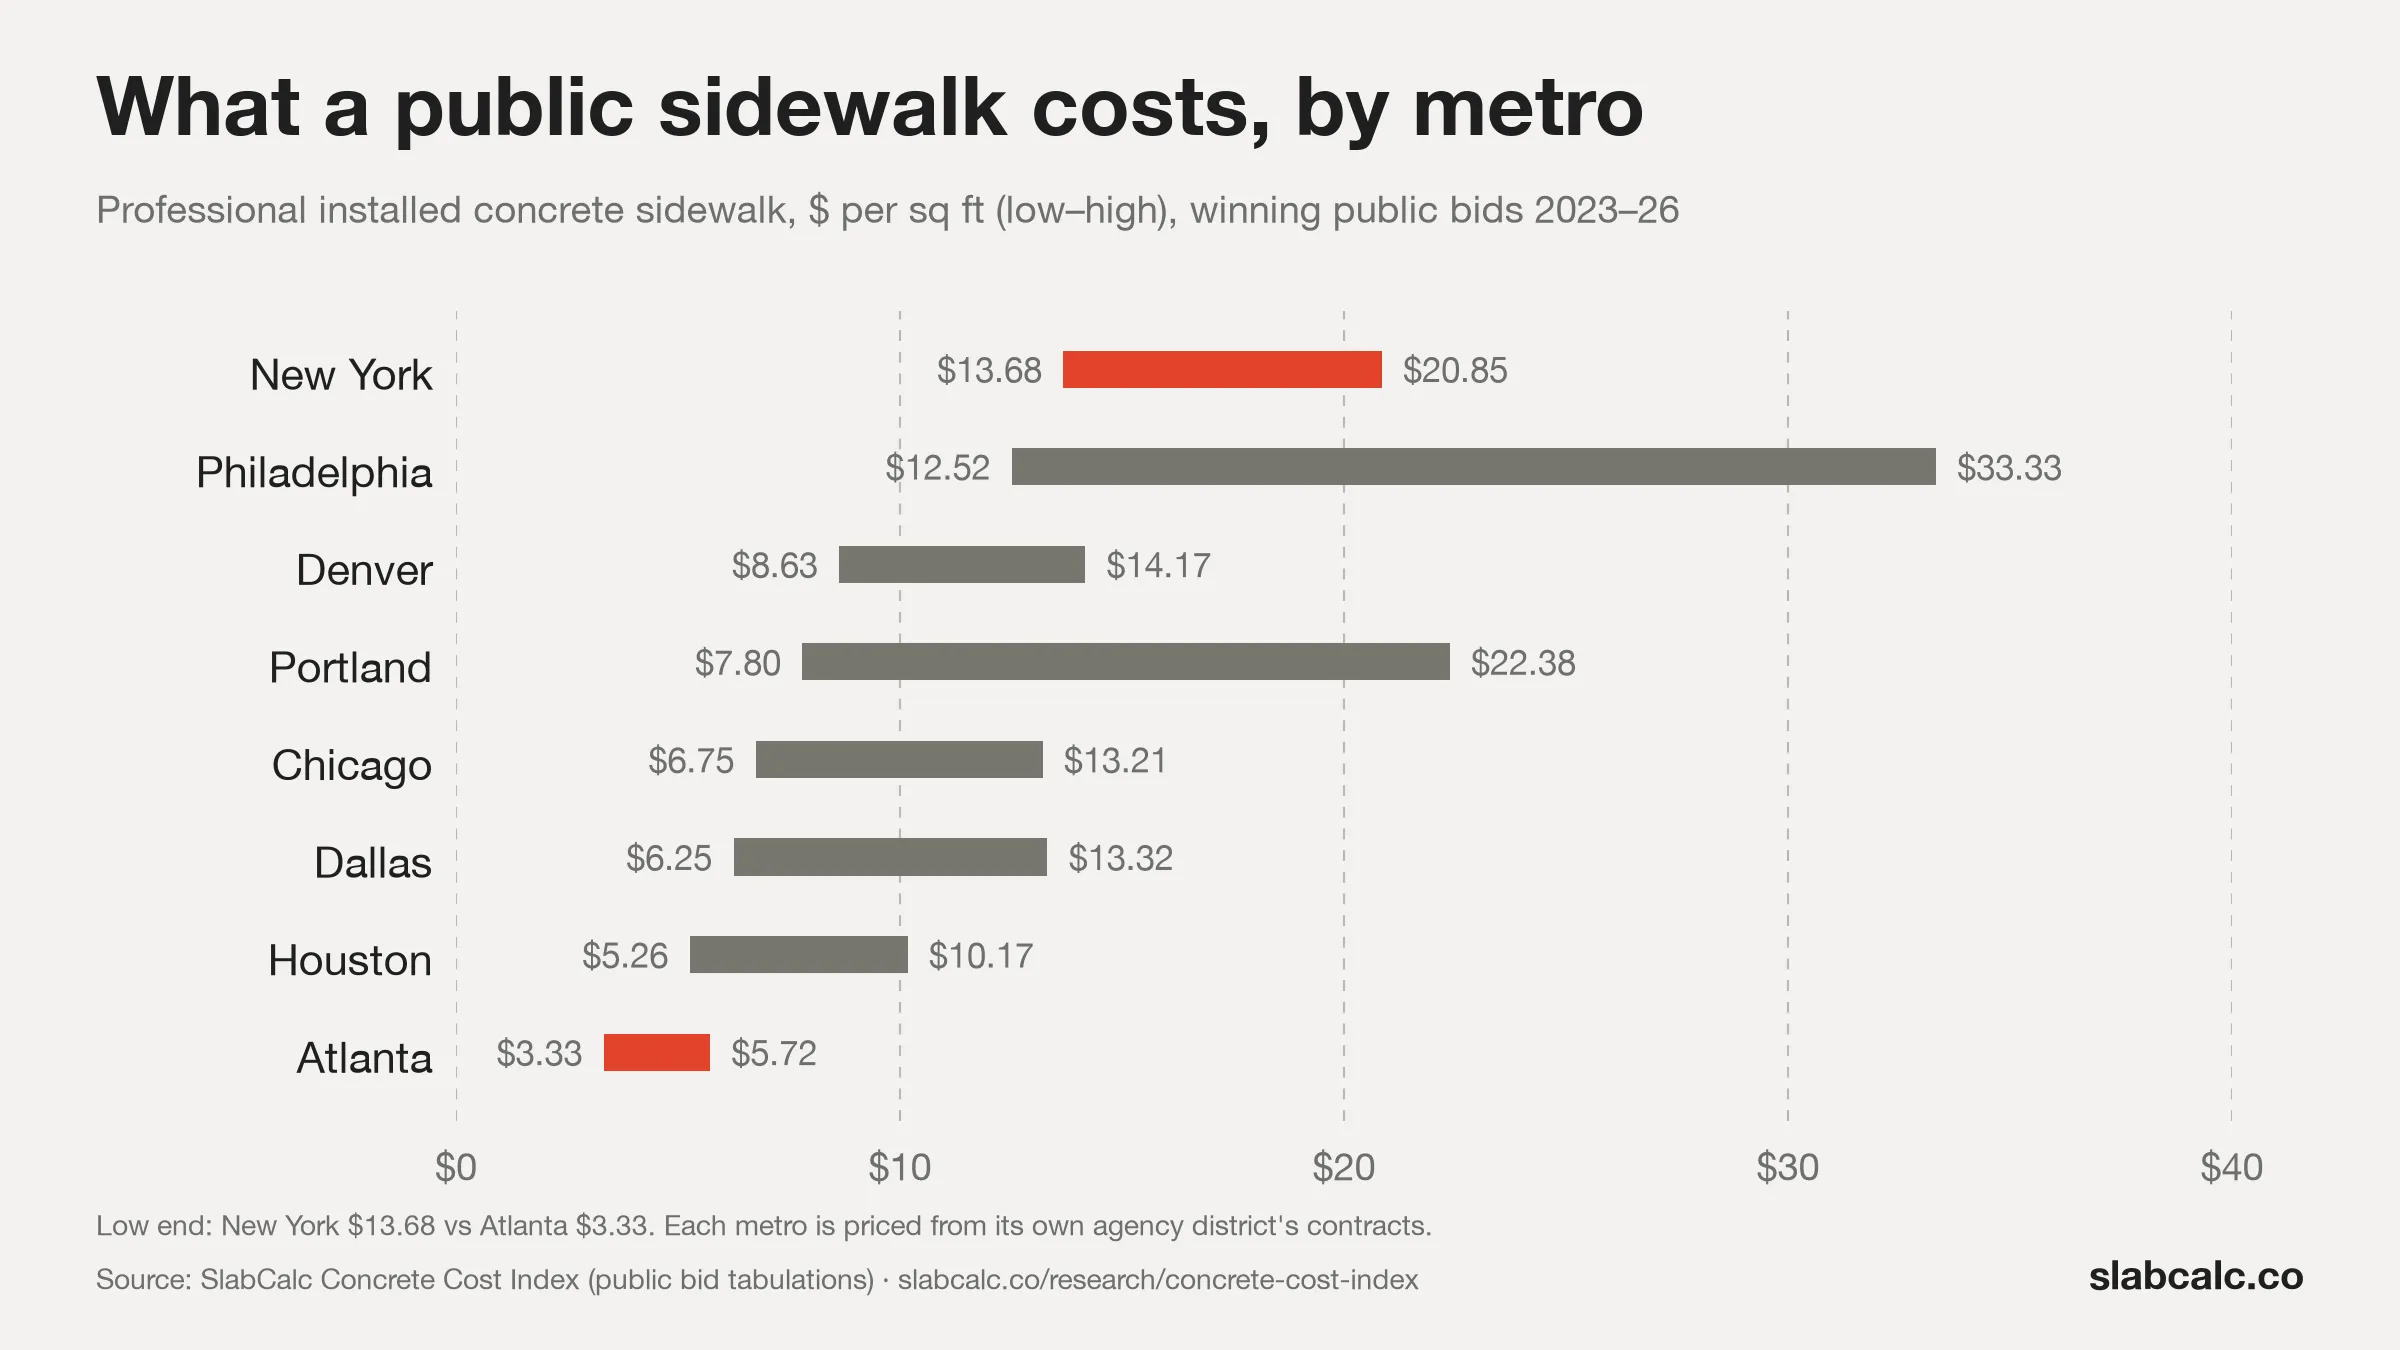
Cost Range by Metro
Low–high professional installed cost per square foot for a standard concrete sidewalk placement, sorted highest to lowest. Axis: $0–34 per sq ft.
Per-Metro Data
Professional installed sidewalk cost per square foot by metro, sorted by low-end price descending. Every row is priced from its own agency district's contracts.
| Metro | $/sq ft (low–high) | Source | Lettings | Contracts |
|---|---|---|---|---|
| New York, NY | $13.68–$20.85 | NYC DDC executed sidewalk contracts | 2024–26 | 9 |
| Philadelphia, PA | $12.52–$33.33 | PennDOT ECMS bid results, District 6-0 | 2023–26 | 50 |
| Austin, TX | $8.86–$16.11 | TxDOT bid tabulations, Austin District | 2023–26 | 6 |
| Denver, CO | $8.63–$14.17 | CDOT Cost Data Books, Regions 1 and 6 (Denver metro) | 2023–25 | 8 |
| Seattle, WA | $8.28–$17.58 | WSDOT bid tabulations, King/Snohomish/Pierce | 2023–26 | 10 |
| Los Angeles, CA | $8.24–$17.28 | Caltrans Contract Cost Database, District 07 (minor concrete sidewalk, per CY at 81 SF/CY) | 2023–26 | 9 |
| San Francisco, CA | $8.20–$15.83 | Caltrans Contract Cost Database, District 04 (minor concrete sidewalk, per CY at 81 SF/CY) | 2023–26 | 18 |
| Portland, OR | $7.80–$22.38 | Oregon DOT bid tabulations, Region 1 | 2023–26 | 28 |
| Riverside, CA | $7.01–$17.71 | Caltrans Contract Cost Database, District 08 (minor concrete sidewalk, per CY at 81 SF/CY) | 2023–26 | 8 |
| Chicago, IL | $6.75–$13.21 | IDOT unit price tabulations, District 1 (5-inch sidewalk, the District 1 standard) | 2023–26 | 448 |
| Sacramento, CA | $6.52–$24.20 | Caltrans Contract Cost Database, District 03 (minor concrete sidewalk, per CY at 81 SF/CY) | 2023–26 | 21 |
| Dallas, TX | $6.25–$13.32 | TxDOT bid tabulations, Dallas District | 2023–26 | 49 |
| Orlando, FL | $5.88–$11.09 | FDOT bid tabulations, District 5 | 2023–26 | 32 |
| Nashville, TN | $5.83–$19.86 | TDOT bid summaries, Region 3 | 2023–26 | 20 |
| Minneapolis, MN | $5.59–$11.00 | MnDOT bid abstracts, Metro District | 2023–26 | 28 |
| Tampa, FL | $5.58–$12.11 | FDOT bid tabulations, District 7 | 2023–26 | 49 |
| Houston, TX | $5.26–$10.17 | TxDOT bid tabulations, Houston District | 2023–26 | 42 |
| Columbus, OH | $5.25–$16.50 | ODOT bid tabulations, District 6 | 2023–26 | 21 |
| Kansas City, MO | $5.20–$10.42 | MoDOT bid tabulations, Kansas City District | 2023–25 | 19 |
| Raleigh, NC | $5.11–$8.98 | NCDOT division bid tabs, Division 5 | 2024–25 | 6 |
| Miami, FL | $5.02–$10.54 | FDOT bid tabulations, District 6 | 2023–26 | 87 |
| San Antonio, TX | $4.91–$10.57 | TxDOT bid tabulations, San Antonio District | 2023–26 | 55 |
| Charlotte, NC | $4.81–$7.31 | NCDOT division bid tabs, Division 10 | 2024–25 | 6 |
| St. Louis, MO | $4.67–$10.69 | MoDOT bid tabulations, St. Louis District | 2023–25 | 33 |
| Detroit, MI | $4.50–$9.14 | MDOT bid letting tabulations, Wayne/Oakland/Macomb | 2023–26 | 159 |
| Atlanta, GA | $3.33–$5.72 | Gwinnett County DOT bid tabulations (GDOT 441-0104 item; GDOT's own tabs require a login) | 2023–26 | 12 |
Modelled Estimates (Not in the Index)
These 4 metros have fewer than five qualifying contracts in their own agency's public records (San Diego, Phoenix), or their agency's line-item bid tabs sit behind a login (Boston, Las Vegas). Their figures are estimates: another metro's bid data scaled by the ratio of local to source-metro construction wages (BLS), or for Phoenix, national indices. They are shown for reference and are excluded from every figure above.
| Metro | $/sq ft (low–high) | How it is estimated |
|---|---|---|
| Boston, MA | $13.39–$35.65 | Modelled: PennDOT ECMS bid results, District 6-0 × labor-cost ratio 1.070 |
| Las Vegas, NV | $8.43–$13.83 | Modelled: CDOT Cost Data Books, Regions 1 and 6 (Denver metro) × labor-cost ratio 0.976 |
| San Diego, CA | $8.41–$17.63 | Modelled: Caltrans Contract Cost Database, District 07 (minor concrete sidewalk, per CY at 81 SF/CY) × labor-cost ratio 1.020 |
| Phoenix, AZ | $4.62–$10.42 | Modelled from national labor and material indices |
Methodology
Every figure above comes from SlabCalc's cost matrix, which is built from public bid tabulations — the unit prices contractors submitted to win government sidewalk work. For each metro we take its own agency district's contracts for the standard 4-inch concrete sidewalk item (5-inch in IDOT District 1, where that is the standard item; Caltrans prices minor concrete sidewalk per cubic yard, converted at 81 sq ft per CY), let in 2023–2026. We use the winning bidder's unit price on every contract line of at least 300 sq ft (smaller lines are patch repairs priced several times the going rate) and report the 25th percentile, median and 75th percentile of those lines. The contract count is the number of distinct contracts behind them. Prices are as bid, not inflation-adjusted. Sources: CDOT, Caltrans, FDOT, Gwinnett, IDOT, MDOT, MnDOT, MoDOT, NCDOT, NYC, ODOT, Oregon, PennDOT, TDOT, TxDOT, WSDOT. The agency, district and bid item for every metro are listed on our methodology page.
Every bid line behind the index is published with the pipeline, together with the agency URL and a checksum of the source document it was read from. A metro is only counted when at least five contracts qualify, and the build refuses any metro labelled as bid data that does not trace to those rows.
Correction, October 12, 2026. An audit found that earlier versions of this index did not meet that standard. St. Louis and Kansas City carried prices that were never read from MoDOT data; Minneapolis and Columbus served fallback constants after their source files went offline; New York was a fixed estimate; and several bid counts (Denver, Charlotte, Raleigh, Minneapolis, Columbus, St. Louis, Kansas City, New York) were typed in rather than counted. Other metros used one statewide average for several cities, or multiplied an average to get a range. The whole index was rebuilt from line-level bid records on this date. Figures from earlier versions (21 metros, 396 bid records, a $9.63 median) are superseded.
This index uses the sidewalk project type as its baseline because it maps most directly onto the underlying DOT bid item across states — a standard concrete flatwork placement — without the additional residential multipliers SlabCalc applies to driveways, patios, foundations, retaining walls, and pool decks. “Low” reflects an efficient contractor working in favorable site conditions; “high” reflects a more complex project or higher-demand contractor market.
Which cost series this index uses: the cost matrix carries two series per metro. The figures on this page are the professional installed series — the estimate of what a hired contractor charges, derived from the DOT unit-bid prices. SlabCalc's consumer cost pages additionally show a DIY-adjusted range, which scales the professional figures down by each metro's labor share to approximate a materials-and-rental self-build. The DIY series is deliberately not used for metro-to-metro ranking here: the labor deflator differs by metro, so ranking on it would reflect local wage structures more than actual concrete prices. If a number on a city cost page looks lower than this index, that is the DIY series doing its job, not a discrepancy.
Limitations
- DOT bid contracts are large-volume infrastructure pours, not residential jobs. The professional installed series shown here is derived from those bid-item prices; small residential jobs typically price above the low end of these ranges because minimum mobilization costs dominate small pours. For project-type-specific homeowner estimates, see the cost pages.
- Some metros rest on fewer than ten qualifying contracts: Austin, TX (6), Raleigh, NC (6), Charlotte, NC (6), Denver, CO (8), Riverside, CA (8), New York, NY (9), Los Angeles, CA (9). Treat their ranges as indicative.
- Atlanta is priced from Gwinnett County's own sidewalk contracts, not GDOT's: GDOT publishes its itemized bid tabs only behind a login. New York is priced from NYC Department of Design and Construction contracts, which are large remove-and-replace programs.
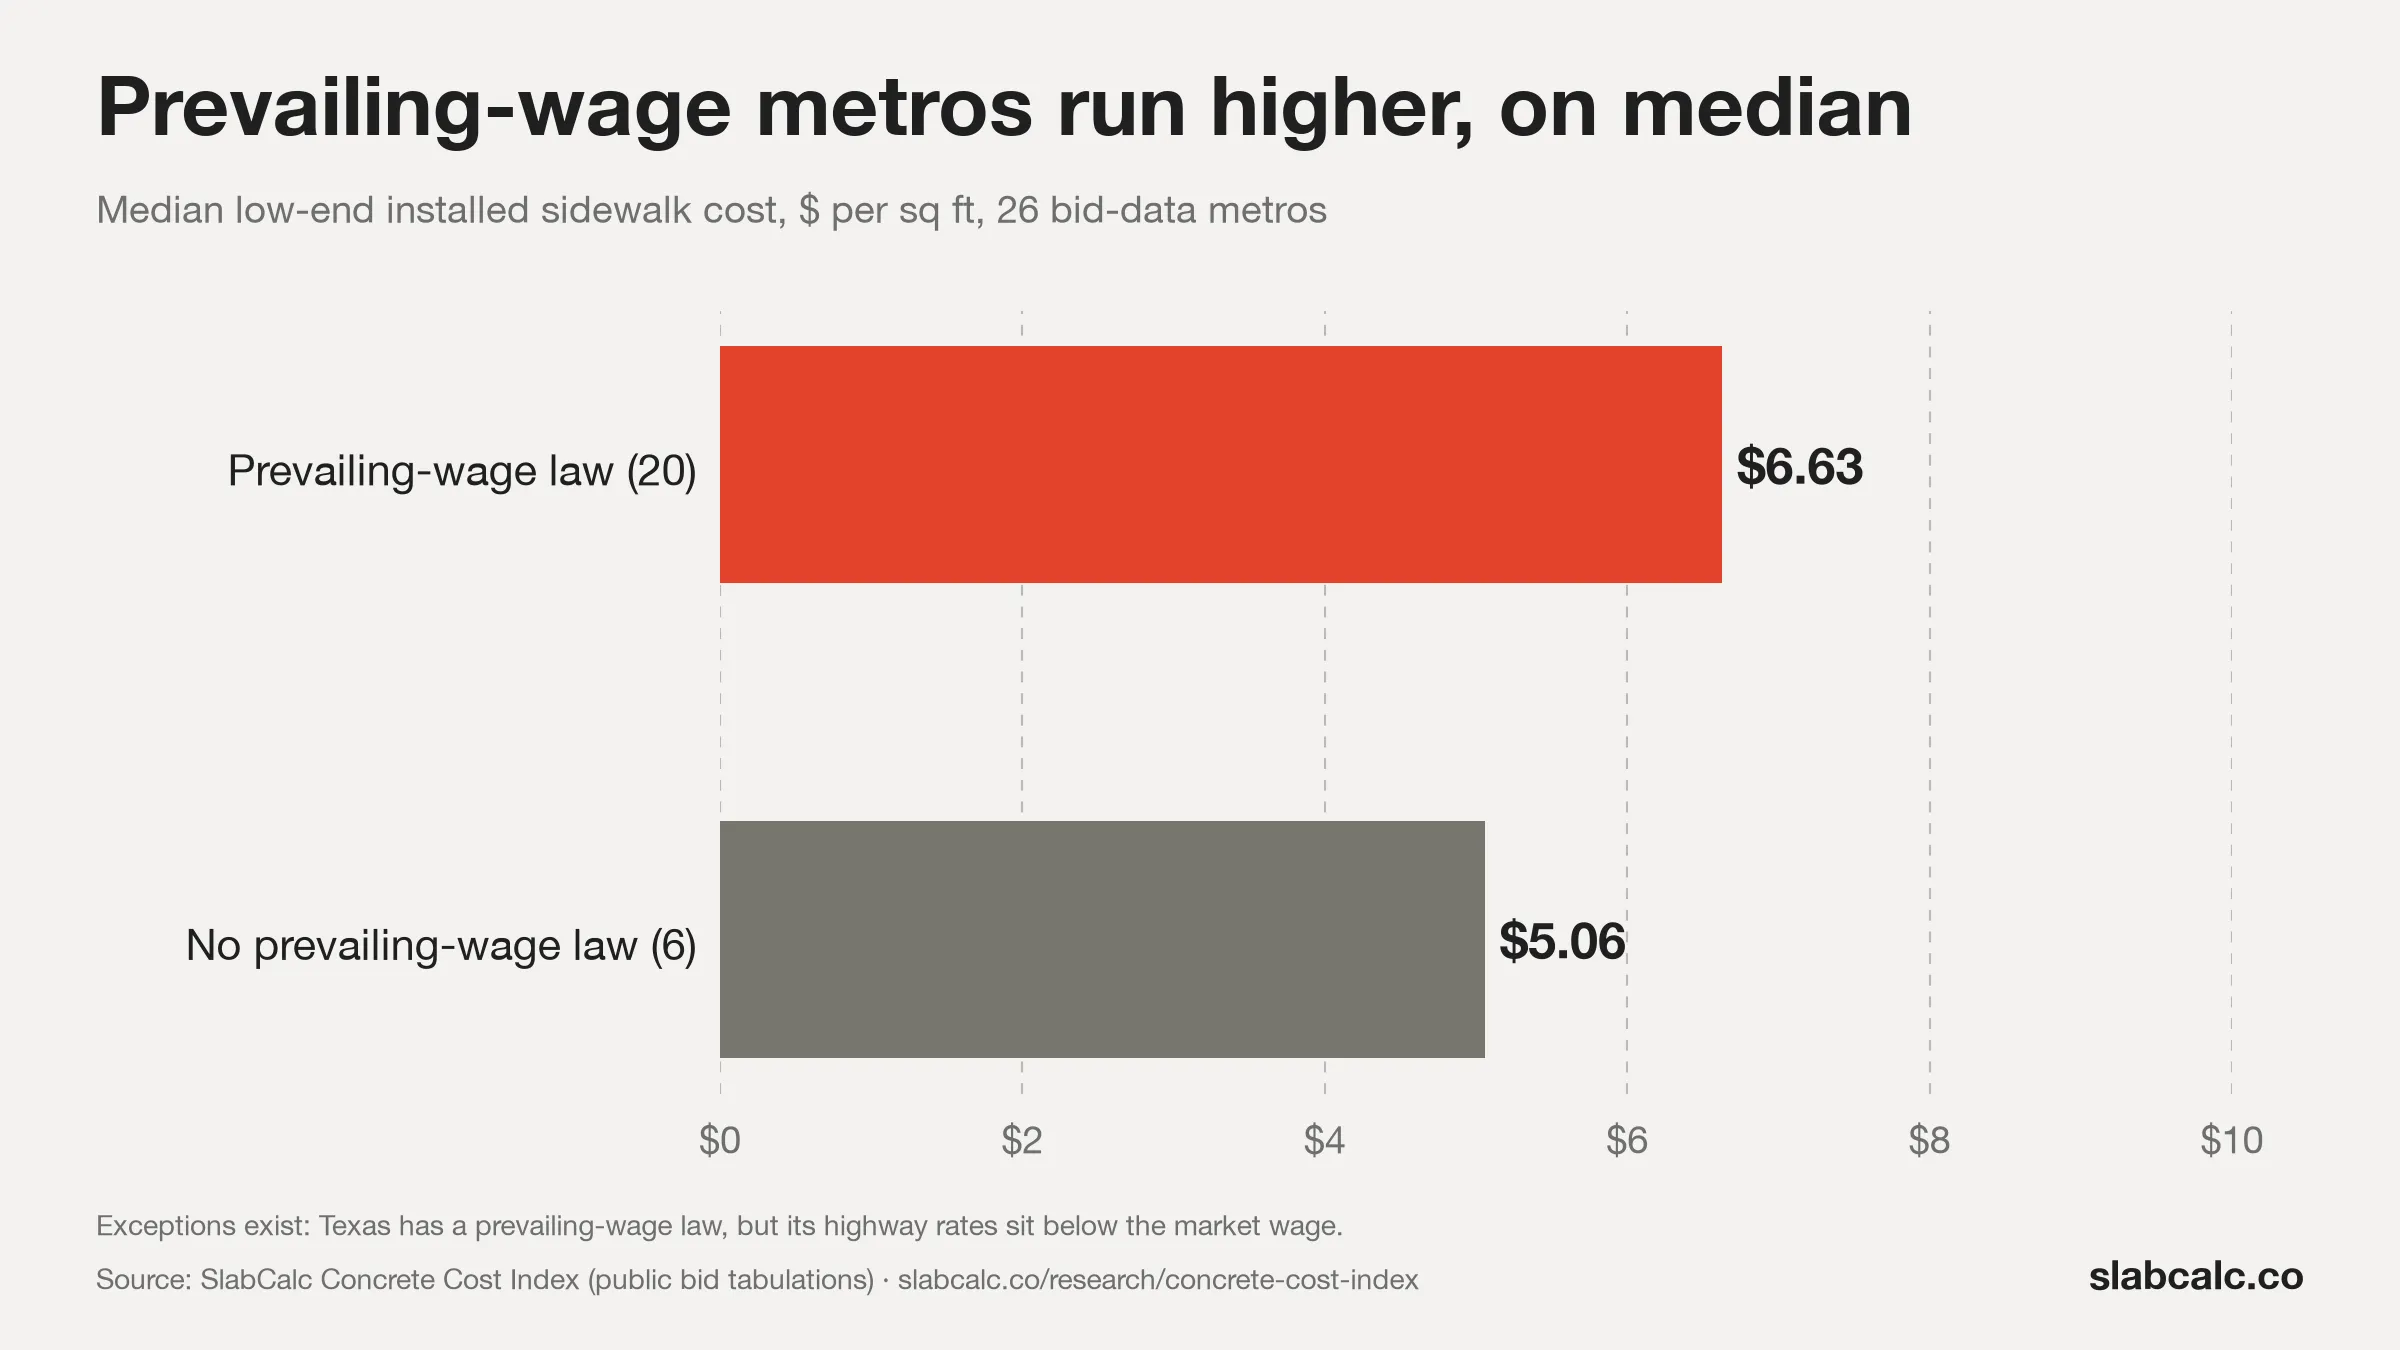
- Some DOT contracts require prevailing-wage or union labor, which can run above typical residential rates. See the full discussion of scale and labor-agreement limitations on the methodology page.
Cite This Data
This dataset is free to cite, reference, and reuse in reporting, research, or analysis — we ask only that you link back to this page as the source.
SlabCalc. (2026). “The SlabCalc Concrete Cost Index: What Flatwork Actually Costs in 26 US Metros.” Retrieved from https://www.slabcalc.co/research/concrete-cost-index. https://doi.org/10.21227/t8fh-8r42
Download the full dataset: slabcalc-concrete-cost-index.csv — all 30 metros across every project type in the matrix. The data_source column marks the 4 modelled and derived metros that are not part of the index.
Persistent identifier: https://doi.org/10.21227/t8fh-8r42 (deposited with IEEE DataPort). Also deposited on Zenodo (https://doi.org/10.5281/zenodo.22689719) and OSF (https://doi.org/10.17605/osf.io/e2fpj).
Full source-by-source methodology — every agency behind the index, the bid records and data years behind each metro, and the bid-line evidence for every figure — is documented on our methodology page. Data last updated October 12, 2026.
Questions about the data or want the underlying figures for a story? Contact us.